May 22, 2020
Download Free Magento Extension at here (click here)
In this post, we will talk about the role of Profiler in Magento 2.
Profiler is used to perform tasks such as analyzing performance in Magento 2.
It will let us know in intricate detail which blocks of code make page load slow, and how long it takes to complete the task of each block.
The profiling's nature depends on the analytical tools we use. Magento 2 supports multiple formats like HTML, CSV or Firebug.
How to enable the Profiler in Magento 2:
We have two ways to enable the Profiler in Magento 2:
1. The first way, we can add the following statement in .htaccess file to enable the profiler :
|
1
|
SetEnv MAGE_PROFILER <type>
|
<type> can be “csvfile” or “firebug” or “html”.
if you use type as “csvfile”, you can find the report in var/log/ dir.
2. The second way, to enable the profiler by using CLI, you can run following command :
|
1
|
php bin/magento dev:profiler:enable <type>
|
<type> can be “html” or “csvfile” or “flagfile”.
if you use type as “flagfile”, a file profiler.flag will be created inside var/ directory.
The “html” type profiler will be enable by default if you do not mention any <type> while executing the command.
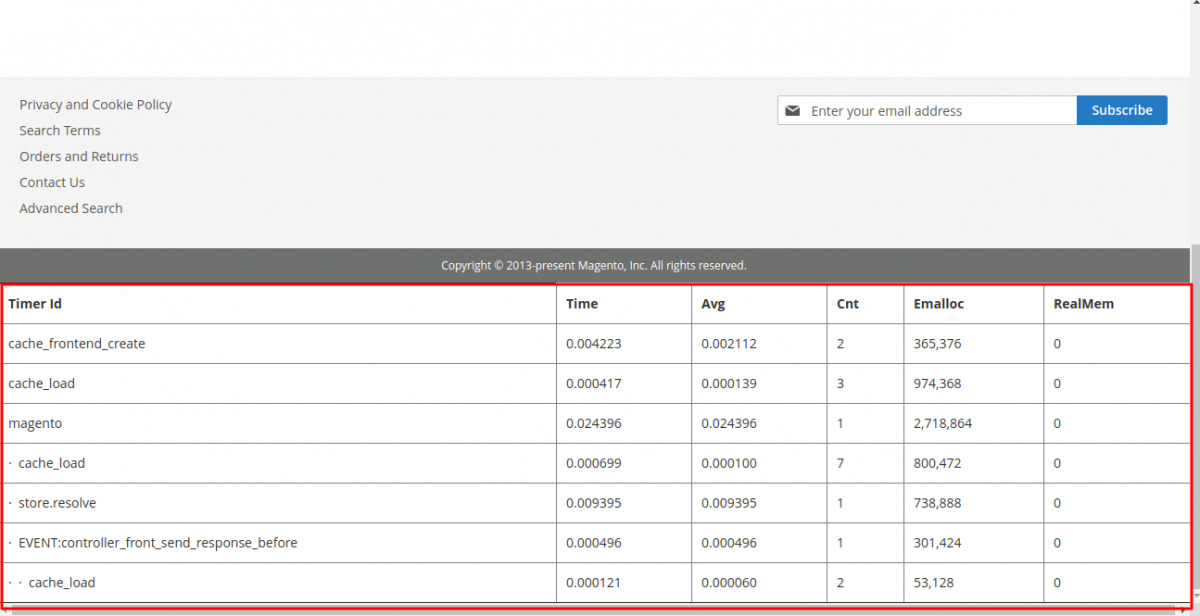
The result will be shown on the footer of website when the "html" type of profiler is being enabled. It looks like in the following image:
How to disable the Profiler in Magento 2:
1. If you enabled the profiler using .htaccess file, now you can disable it by removing the statement that you added:
|
1
|
SetEnv MAGE_PROFILER <type>
|
2. If you enabled the profiler using CLI, now you can disable it by running the following command:
|
1
|
php bin/magento dev:profiler:disable
|
How to add Custom Profiler in specific code:
we can use custom profiler when we need to measure the performance of custom code/script.
There are two methods Magento provided in \Magento\Framework\Profiler class: start() and stop() to add custom profiler in custom code.
start(): In this method, we pass the custom profiler name as parameter, which will measure the performance of the code for example execution time etc.
stop(): In this method, we pass the custom profiler name as parameter which have to be stopped.
|
1
2
3
4
5
|
\Magento\Framework\Profiler::start('custom-profiler-name');
/***
* write your code here for which custom profiler will calculate the execution time or measure the performance of code
**/
\Magento\Framework\Profiler::stop('custom-profiler-name');
|
We can add a custom profiler as following example:
|
1
2
3
4
5
6
7
8
9
|
/**Custom Profiler starts here**/
\Magento\Framework\Profiler::start('custom-profiler-name');
/**custom script statements**/
$resultPage = $this->resultPageFactory->create();
$resultPage->getConfig()->getTitle()->set(__("Example"));
\Magento\Framework\Profiler::stop('custom-profiler-name');
/**Custom Profiler ends here**/
|
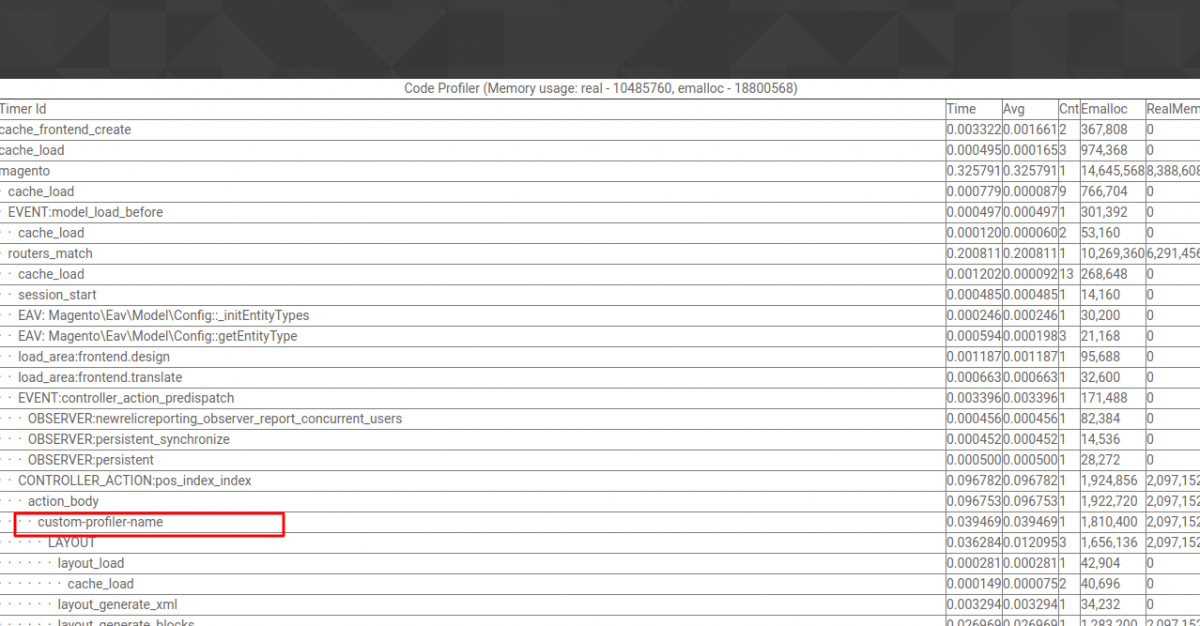
If you have enabled the “html” type profiler then you can see your custom profiler as following image:
In html output profiler, the columns are as follows:
Timer Id: This gives the name of the block of code being executed.
Time: The time it took to complete in seconds.
Avg: The average time it took to complete in seconds.
Cnt: Short for Count. This represents the number of times this individual block ran to generate the output required.
Emalloc: The amount of memory PHP ( the programming language on which Magento runs) assigned to this single operation. This is again represented in bytes.
RealMem: The actual amount of memory used to perform the operation.
Hope this will help you to analyse the performance of the code.
Thanks